Mapping: Use of Compass
and Transit
Mapping: Use of Compass
In this lab, you will learn how to use a compass to map some
significant landmark here on campus.
When discussing features of any ecosystem/community, it is
useful to be able to plot them on a map for future reference. Also, factors
such as whether an organism is found on the north or south side of a hill are
important in discussing some aspects of that organism, because, for example,
the north side of a hill stays colder longer in spring. Thus,
topological maps
can help in understanding various ecological phenomena.
 An important measurement when doing mapping is to determine the
azimuth.
This is done with a compass or transit (note, compass needles point to
magnetic north, not true north). On the type of compass we have here, the
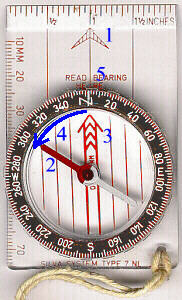
red end of the needle is the north end. To determine an azimuth,
(1)
first point the large arrow on the flat bottom of the compass in the
direction for which you wish to determine the azimuth. Next,
(2)
observe where the needle is pointing (north) and turn the black ring
(4)
(with numbers and directions indicated on it) until the red arrow
(3)
and other lines on the bottom of the circle are lined up parallel to the
needle. The base of the big red arrow
(5)
will, then, point to the number which is the azimuth reading.
An important measurement when doing mapping is to determine the
azimuth.
This is done with a compass or transit (note, compass needles point to
magnetic north, not true north). On the type of compass we have here, the
red end of the needle is the north end. To determine an azimuth,
(1)
first point the large arrow on the flat bottom of the compass in the
direction for which you wish to determine the azimuth. Next,
(2)
observe where the needle is pointing (north) and turn the black ring
(4)
(with numbers and directions indicated on it) until the red arrow
(3)
and other lines on the bottom of the circle are lined up parallel to the
needle. The base of the big red arrow
(5)
will, then, point to the number which is the azimuth reading.
The pocket transit may also be used as a
compass the white tip of the needle points to the azimuth reading.
Equipment Needed
The following equipment will be needed:
- magnetic compass
- metric measuring tapes
- orange flags
- opt. pocket transit
- protractor and straightedge
- calculator with trig functions or trig tables
Procedure
The compasses (and/or transit) will be used, in conjunction
with measuring tapes, to map a designated landmark here on the Clermont
campus.
- Insert an orange flag at the location
where you are planning to start mapping and if appropriate, establish the
location of this point with respect to some previously-mapped item(s).
- Imagine that the landmark to be mapped
is composed of a series of shorter, straight segments. From this first flag,
look to where the first straight segment stops and turns a corner, however
slight. Place an orange flag at that location. Measure the distance from
one flag to the next.
- With the compass, sight from each
flag to the other and determine the azimuth (In what direction is this
segment aligned?). Sight both ways to double check the readings should
be 180° apart.
- Mark a new position past the second
one where the direction changes again. Again, measure the distance between
the flags, and determine the azimuth for that section.
- Continue in this manner until the
whole landmark is measured. If you notice any other interesting features,
feel free to make note of them, including distance and azimuth relative
to one or two of the orange flags.
- Make sure all supplies, including all
flags, are accounted for and return them to the lab.
- Enter your data into the
mapping data Web page
so a class graph may be generated.
- Either in lab or on your own, as time
permits, use a straightedge and protractor to make a map from your readings:
- North
should probably be toward the top of your notebook page (azimuth = 0°),
and you should decide on the scale (1 cm = how many meters?).
- Using
the distance and azimuth readings, plot the map. Also, indicate
the width of any features such as stream(s) or trail(s) according to
your scale and location(s) of any significant features noted. Place
the base of your protractor along the north-south axis of your paper
with the center at whatever point you are. Then measure off whatever
angle corresponds to the azimuth reading you are mapping (for example,
an azimuth reading of 10° or 350° would be plotted as 10° from 0°
[= north] to right or left sided as needed).
- This
map can now be used for any further studies done here on campus. Any
future discoveries can be plotted on the map by measuring distance
and azimuth relative to something already plotted. Alternately, by
taking two azimuth readings, the location of an object can be plotted
by intersecting the lines drawn at the two angle readings
(triangulation).
Use of Transit:
In this portion of the lab exercise, you will learn how to use
a level-transit and some of the applications for which it may be used.
The level-transit should be mounted on its tripod to use it.
You will need to level it using the four screw-feet. Locked into position,
it can do level sightings in any horizontal direction to establish the angle
between two objects. Released, it can do sightings in any vertical direction.
Knowing appropriate angles as measured by the transit and a little
trigonometry,
one can calculate the height of objects such as hills and trees. See the
accompanying illustrations for derivations of formulae to be used. The
pocket transit can be used in a similar manner to determine angles between
two objects (with the added advantage of using the actual azimuth readings)
or to the top of a tree or hill.
The transit can also be used to determine elevations of
objects such as the height of a hill or a tree. Note: you will also need
a meterstick (or longer measuring device).
- Choose an object such as a hill or
tree whose height you wish to determine. Refer to the accompanying
illustrations (below) to decide which is applicable in your situation.
- Based on the instructions accompanying
that illustration, take the necessary measurements to determine the height of
the object.
- Do the necessary calculations to
determine the height of the object. Use a calculator or computer with trig
functions (or a trig table) to determine the tangents needed for the
calculations.
Use of Transit to Determine Heights of Land Features
Big Hill
Small Hill
Valley
Measure: A (height of transit), α (angle to top edge of hill),
β (angle to height of transit above hill).
Then, H = A + G,
but tanα = G/L, so G = L(tanα)
and tanβ = H/L = (A + G)/L
A + G = L tanβ)
A = L(tanβ) G
A = L(tanβ) L(tanα)
A = L(tanβ tanα)
L = A/(tanβ tanα)
Since G = L(tanα), then
and since H = A + G,
| H = A + | A(tanα)
(tanβ tanα) |
| H = A | [ | 1 + | (tanα)
(tanβ tanα) | ] |
| H = A | [ | (tanβ tanα + tanα)
(tanβ tanα) | ] |
thus,
| H = | A (tanβ)
(tanβ tanα) |
Note that upward angles (and their tangents) are considered positive, while
downward angles (and their tangents) are negative. A is the height of the
transit and H represents the change in height of the ground. A hill would
be a positive change in ground height, while a valley would be a negative
change in ground height.
Use of Transit to Determine Heights of Trees
Tree on Big Hill
Tree on Small Hill
Tree on Level Ground
Tree in Valley
Measure: A (height of transit), α (angle to base of tree),
β (angle to height of transit above base of tree), γ (angle to
top of tree).
tanβ = H/L,
but H = A + G, so
tanβ = (A + G)/L
A + G = L(tanβ).
Also, tanα = G/L,
so G = L(tanα).
Thus, A + L(tanα) = L(tanβ)
A = L(tanβ tanα)
L = A/(tanβ tanα).
Also, tanγ = (G + B)/L, so
G + B = L(tanγ)
B = L(tanγ) G
B = L(tanγ tanα)
thus,
| B = | A (tanγ tanα)
(tanβ tanα) |
In addition to the above notes, B is the height of the tree. On level
ground, the equation is simplified because angle β, its tangent, and
H (the change in ground height) all are 0, thus, G = A.
Copyright © 1998 by J. Stein Carter. All rights reserved.
This page has been accessed  times since 26 Jun 2001.